
I am currently pouring through all the analytics data. But what I found is something that I don’t think is correct in the advanced analytics.
And I am specifically talking about the User analytics. Hopefully someone at Bynder can explain the rationale behind how and why it’s measured this way.
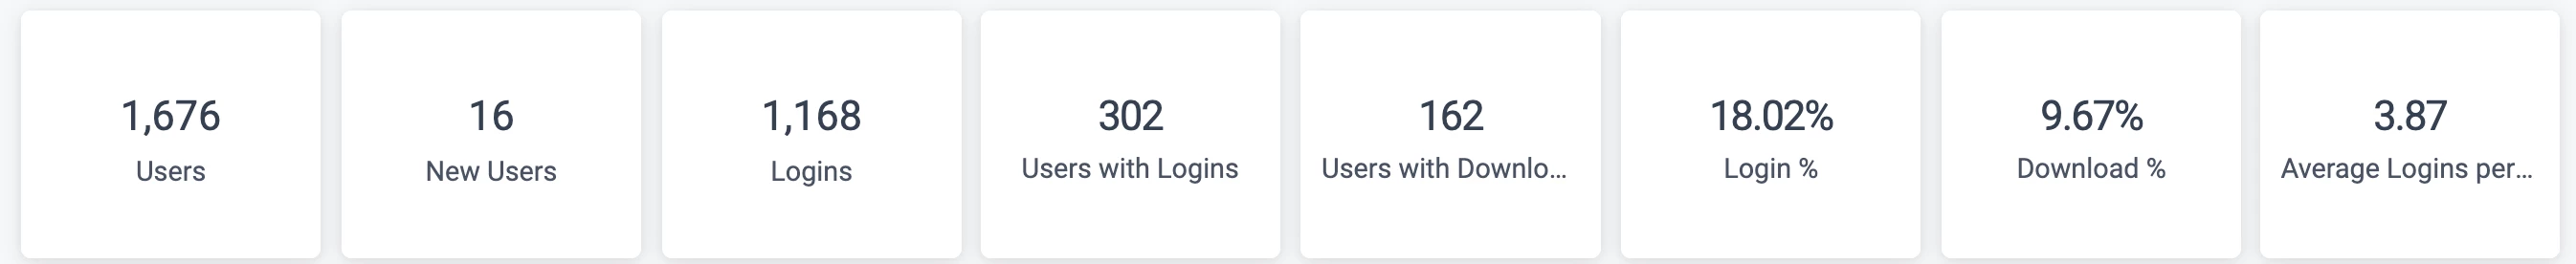
So we have these figures for this month.
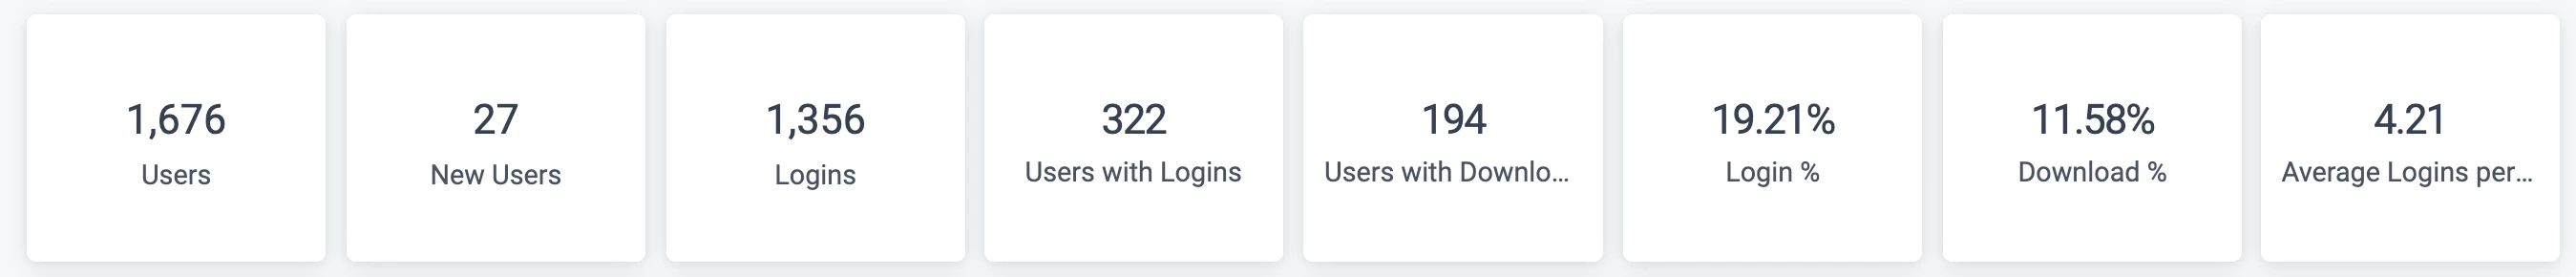
Now if I go back a month, and the total amount of users has changed, since there have been users added and deleted, but it isn’t reflected here.
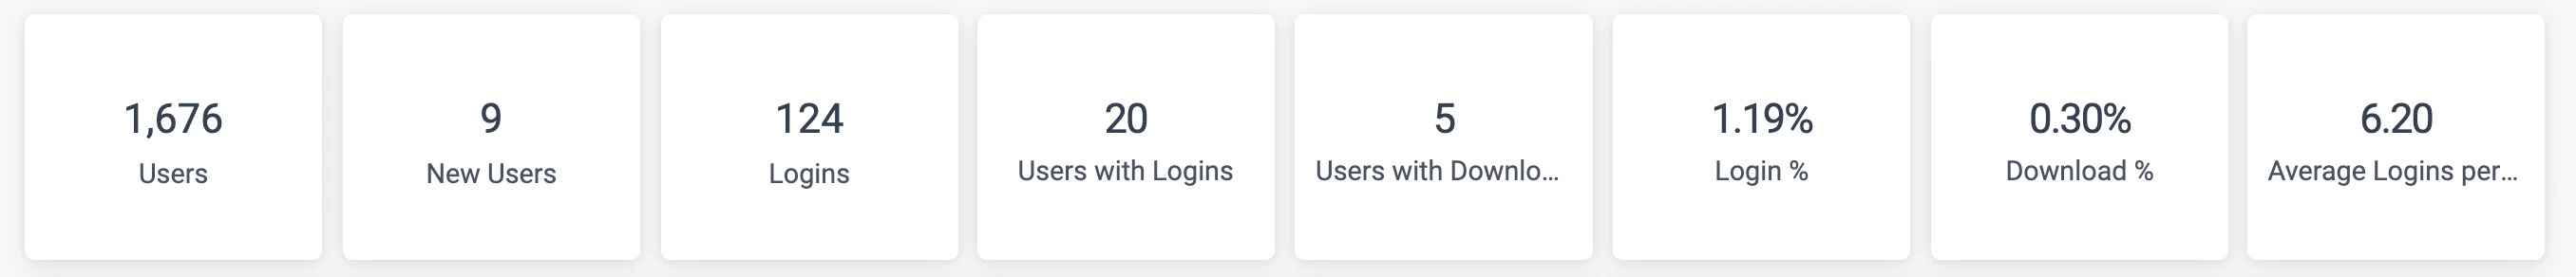
If I go back even further the user amount stays the same. Which in turn would change the percentages every month. so I could go back as far as 2018.
The problem I have with this is that the percentages don’t match the month and year I am looking at. So I have no way of knowing what has changed, is it getting better is it getting worse. If you’re not diligent enough to save the data at the end of the month, you have proper data, but now it constantly changes. Maybe that’s the idea behind it. But to me, you’re mixing login% from january 2018 on the basis of users in february 2026. What does that tell me?
It’s also very difficult to figure out the amount of users we had in any given month. The only way now is to use the change history to see how many users where deleted and subtract that from the new users to get an accurate users added that month. I’d like to see a deleted users in here as well. And even then I am not entirely sure if it’s correct. We rolled out fully at the end of 2017, but I highly doubt we had 513 users back then, we didn’t even have that many employees. But that’s what the math tells me if I go back from the current amount of users..There wasn’t an advanced analytics back then so historical data is pretty sketch as is.
Maybe it’s just me that has an issue with this, and others like it this way.
